Back to Exercise: Fit a linear function to a scatter plot

Exercises: Fitting a Linear Function to a Scatter Plot

Work through each section in order. When a scatter plot is shown, first
decide whether it suggests a LINEAR association before fitting a line. To
find a line's equation, read two convenient points ON the line (not
necessarily data points), compute slope as rise over run, and find the
y-intercept. Remember: a line of fit balances points above and below and
need not pass through any data point.

Grade 9·22 problems·~35 min·Common Core Math - HS Statistics and Probability·standard·hss-id-b-6c
Work through problems with immediate feedback
A

Warm-Up: Slope, Lines, and Form

These problems review slope and line basics you already know.

1

Before fitting a line to a scatter plot, what must you first confirm about the data?

2

A line passes through the points (2,14)(2, 14) and (6,26)(6, 26). What is the slope of this line?

3

A fitted line has equation y=4x+9y = 4x + 9. Use it to predict yy when x=5x = 5.

B

Fluency Practice

Read scatter plots, judge form, and find or use line equations.
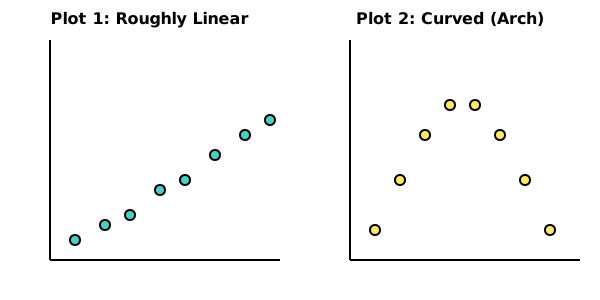
Two scatter plots side by side. The left plot shows points in a roughly straight rising band. The right plot shows points forming a curved arch that rises then falls.
1

Two scatter plots are shown. Plot 1 shows points rising in a roughly straight band; Plot 2 shows points rising then falling in a clear arch. For which plot is fitting a linear function appropriate?
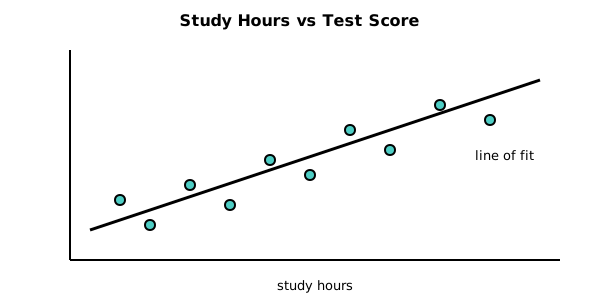
A scatter plot of study hours versus test score with a rising straight line drawn through the middle of the point cloud. The line touches no data point; some points lie above it and some below.
2

A scatter plot of study hours xx versus test score yy is shown with a line drawn through the cloud. The line passes through none of the plotted data points, yet roughly as many points sit above it as below. Is this a reasonable line of fit?

3

A drawn line of fit passes through the points (0,50)(0, 50) and (10,110)(10, 110). What is the slope of this line?

4

The same line of fit passes through (0,50)(0, 50) and (10,110)(10, 110), giving slope 66. What is the yy-intercept aa in the equation y=a+bxy = a + bx?

5

A student eyeballs a line of fit as y=5x+53y = 5x + 53. Their calculator's least-squares regression line is y=5.8x+51y = 5.8x + 51. Is the student's hand-drawn line wrong?

You're viewing 2 of 6 sections.

Create a free account to continue the full exercise set and save your progress.

Create free account
0 of 8 answered

Answer all problems to submit.

Was this practice set helpful?
Report a problem with this page