Exercises: Assess Fit by Analyzing Residuals
Work through each section in order. A residual is observed minus
predicted: positive when the data point is ABOVE the model, negative
when below. Keep the sign. When reading a residual plot, remember the
key idea: random scatter around zero means a GOOD fit, while a clear
pattern (a curve or a fan) means the model is wrong.
Warm-Up: What Is a Residual?
These problems review the residual definition and its sign.
A function is fitted to data. For one data point, the observed value is and the model's predicted value is . What is the residual at this point?
A line models a phone bill, where is minutes used. At minutes a customer was actually charged . The model predicts . What is the residual (observed predicted) for this customer?
Fluency Practice
Compute residuals and read residual plots.
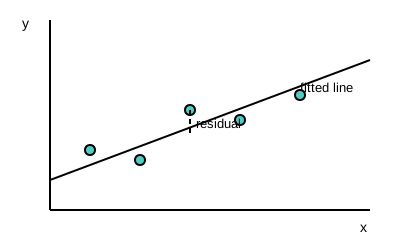
The scatter plot below shows data with a fitted line. For the highlighted point, the observed value is and the line predicts at that . What is the residual (observed predicted)?
A line is fitted to data. At the observed value is . Compute the residual (observed predicted) at this point.
You have these residuals at the given -values: , , , . To build the residual plot, where does the point for go relative to the zero line?
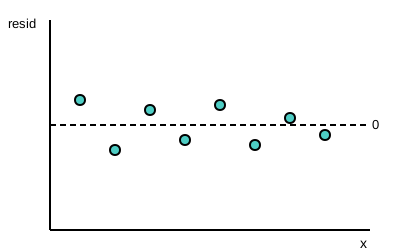
The residual plot below shows residuals scattered randomly around the zero line with no clear pattern. What does this say about the fit of the model?
You're viewing 2 of 6 sections.
Create a free account to continue the full exercise set and save your progress.
Create free accountAnswer all problems to submit.