Back to Assess fit by analyzing residuals — Problem 4 · Task Set 7
Exercises: Assess Fit by Analyzing Residuals
Work through each section in order. A residual is observed minus
predicted: positive when the data point is ABOVE the model, negative
when below. Keep the sign. When reading a residual plot, remember the
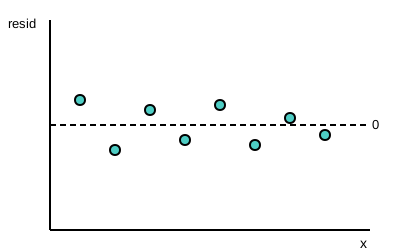
key idea: random scatter around zero means a GOOD fit, while a clear
pattern (a curve or a fan) means the model is wrong.
Grade 10·20 problems·~35 min·Common Core Math - HS Statistics and Probability·standard·hss-id-b-6b
Work through problems with immediate feedback
A
Fluency Practice
Compute residuals and read residual plots.
1
The residual plot below shows residuals scattered randomly around the zero line with no clear pattern. What does this say about the fit of the model?